
Waste Oil Recycling ROI Calculator: Estimate Plant Profitability Before You Invest
Written By: Mr.Ran
Senior Petrochemical & Waste Oil Recycling Engineer
Deeply involved in the design, manufacturing, and optimization of various waste oil recycling and petrochemical equipment, delivering practical and efficient solutions for clients worldwide.
When evaluating a waste oil recycling plant investment, project developers, plant owners, and financial investors continually analyze three primary questions:
- Can this plant make money? (Understanding gross profit margins, operational overhead, and long-term economic viability)
- How long is the payback period? (Determining the precise operational timeline required to recover total capital expenditure)
- What factors affect ROI? (Pinpointing key operational drivers such as feedstock pricing, base oil yield, energy consumption, and product quality)
This comprehensive guide provides a detailed financial and operational framework for evaluating a waste oil recycling project. By leveraging this structured ROI calculation model, investors can evaluate project feasibility, accurately project cash flows, and make data-driven investment decisions prior to allocating capital.
Section 1: What Is ROI in Waste Oil Recycling?
In industrial chemical process engineering, Return on Investment (ROI) serves as the ultimate metric for measuring how efficiently a re-refining plant generates profit relative to the total capital invested. To calculate an accurate ROI, five foundational financial components must be clearly defined:
- Initial Investment (CAPEX): The complete upfront capital required to bring the facility into commercial operation. This includes land acquisition, civil engineering, foundation works, continuous distillation equipment, hydrotreating/solvent extraction units, utility boilers, storage tank farms, environmental scrubbing systems, design engineering, and initial working capital.
- Operating Cost (OPEX): The ongoing daily expenses required to run the facility continuously. OPEX includes raw feedstock acquisition, electrical power, heating fuels, catalytic agents, chemical consumables, labor payroll, routine maintenance, hazardous sludge disposal, and administrative overhead.
- Annual Revenue: Total gross receipts generated from selling output fractions—primarily premium Group I or Group II base oils (SN150, SN300, SN500), light fuel oil (diesel fraction), and asphalt flux bottoms.
- Net Profit: The net earnings remaining after deducting total OPEX, equipment depreciation, interest expenses, and corporate taxes from gross annual revenue.
- Payback Period: The total operational time (expressed in years) required for cumulative net cash inflows to fully recover the initial capital outlay (CAPEX).
Section 2: What Key Factors Determine ROI?
The financial performance of a waste oil recycling facility is dictated by a combination of chemical process parameters and market conditions. The following table details the key factors influencing project returns:
| Operational Factor | Impact on ROI | Detailed Analysis & Impact Explanation |
| Feedstock Price | Very High | Feedstock acquisition typically accounts for 60% to 75% of total operating expenditure (OPEX). Securing stable, low-cost raw Used Motor Oil (UMO) is the single most critical driver of profitability. |
| Base Oil Selling Price | Very High | Dictates top-line revenue. Upgrading from standard Group I base oil to high-purity Group II base oil significantly increases sales realization per ton. |
| Base Oil Yield | Very High | Process recovery efficiency is crucial. Increasing yield from 65% to 78% converts low-value residue into high-value product, boosting net margins directly. |
| Plant Capacity & Scale | High | Higher throughput capacities (e.g., 20–50 TPD) benefit from economies of scale, dramatically reducing fixed operating overhead per ton. |
| Plant Uptime & Reliability | High | Continuous annual operation (300–330 days/year) minimizes idle facility overhead and prevents thermal cycling damage to distillation reactors. |
| Energy Consumption | Medium | Thermal fuel (natural gas/diesel/heavy oil) and electricity usage for deep vacuum pumping systems impact per-ton processing costs. |
| Solvent Recovery Efficiency | Medium | For extraction-based plants, maintaining a solvent recovery rate above 99.5% prevents expensive solvent replenishment costs. |
| Labor Cost | Medium | Automated PLC/DCS systems reduce direct manual operator headcount, lowering payroll liabilities while enhancing process safety. |
| Maintenance & Spares | Medium | Routine replacement of mechanical seals, heat exchanger tubes, vacuum pumps, and refractories protects operational continuity. |
| Catalyst & Chemical Cost | Low | Includes active clays, hydrotreating catalysts, and neutralization chemicals. Optimizing chemical dosing protects margins while maintaining oil color stability. |
Section 3: Waste Oil Recycling ROI Formula
Calculating the ROI of a waste oil re-refining plant follows a sequential financial cascade:
Annual Revenue → Operating Cost (OPEX) → Gross Profit → Net Profit → ROI (%) / Payback Period
Core Mathematical Formulas:
ROI = (Annual Net Profit ÷ Total Initial Investment CAPEX) × 100%
Payback Period (Years) = Total Initial Investment (CAPEX) ÷ Annual Net Profit
Baseline ROI Example:
- Total Initial Investment (CAPEX): $2,000,000 (Turnkey plant, engineering, installation & working capital)
- Annual Net Profit (Post-Tax): $650,000
- Calculated ROI: 32.5% per annum
- Simple Payback Period: 3.08 Years
Section 4: Sample ROI Calculation Model (20 TPD Plant)
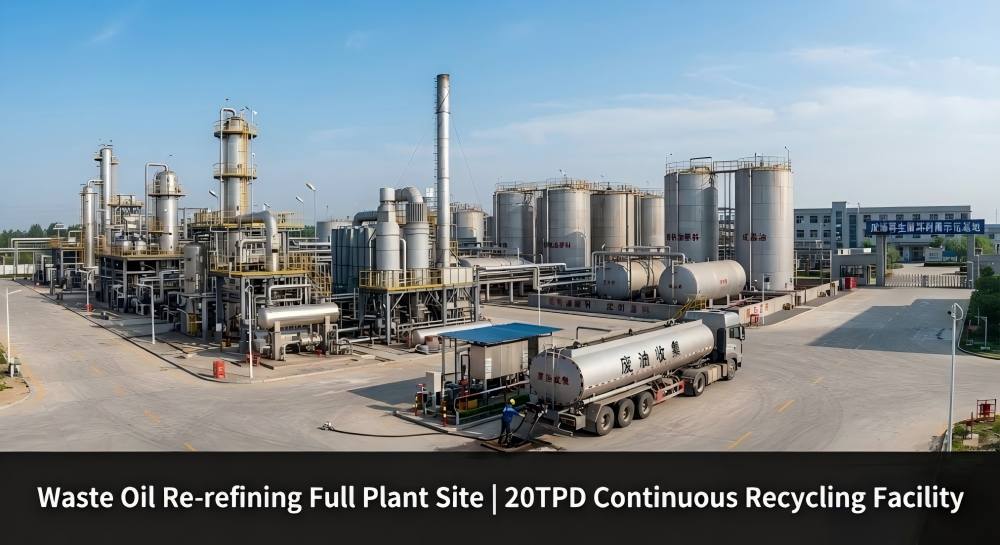
Below is an operational financial model for a 20 Tons Per Day (TPD) continuous waste oil re-refining plant operating 330 days per year (6,600 tons total annual processing throughput):
| Financial & Operational Metric | Value / Baseline Assumption | Annual Total (USD) |
| Plant Nameplate Capacity | 20 Tons / Day (Continuous 24-hour operation) | – |
| Annual Operating Days | 330 Days / Year (35 days planned maintenance) | 6,600 Tons Processed |
| Feedstock Procurement Price | $380 per Ton (Used Motor Oil – UMO) | $2,508,000 |
| Base Oil Output Yield (75%) | 4,950 Tons Base Oil @ $860 / Ton | $4,257,000 |
| Light Fuel / Diesel Yield (12%) | 792 Tons Light Fuel @ $620 / Ton | $491,040 |
| Asphalt Bottoms Yield (8%) | 528 Tons Flux Bottoms @ $210 / Ton | $110,880 |
| Process Loss / Water Content (5%) | 330 Tons Moisture / Waste Loss | $0 |
| GROSS ANNUAL REVENUE | Combined Product Sales | $4,858,920 |
| Feedstock Acquisition Cost | 6,600 Tons @ $380 / Ton | $2,508,000 |
| Utilities (Electricity, Natural Gas) | $45 per Ton processed | $297,000 |
| Chemicals & Catalysts | $28 per Ton processed | $184,800 |
| Labor & Operational Staff | 8 Operators, 2 Engineers, 1 Plant Manager | $240,000 |
| Maintenance, Spares & Sludge | $18 per Ton processed | $118,800 |
| Insurance, Admin & Compliance | Fixed annual allocation | $80,000 |
| TOTAL ANNUAL OPERATING COST (OPEX) | Raw Material + Operational Inputs | $3,428,600 |
| ANNUAL GROSS PROFIT | Gross Revenue minus OPEX | $1,430,320 |
| Depreciation & Financing (Est.) | 10-year linear equipment depreciation | $180,000 |
| Corporate Tax Reserve (Est. 20%) | Calculated on taxable income | $250,064 |
| ANNUAL NET PROFIT (POST-TAX) | Retained Net Cash Flow | $1,000,256 |
| CAPEX (Turnkey Facility Cost) | 20 TPD Advanced Thin-Film Plant | $2,200,000 |
| NET ANNUAL ROI (%) | (Net Profit ÷ CAPEX) × 100% | 45.47% |
| PROJECT PAYBACK PERIOD | CAPEX ÷ Annual Net Profit | 2.20 Years |
Section 5: Breakdown of Typical Operating Costs (OPEX)
A detailed analysis of operational expenses (OPEX) reveals six core components:
1. Feedstock Acquisition (60% – 75% of Total OPEX)
Raw material costs represent the primary operational expenditure. Establishing direct collection networks with automotive service chains and industrial sites helps secure raw UMO at stable pricing.
2. Electricity Consumption
Powers continuous high-vacuum systems, multi-stage centrifugal pumps, agitators, and oil transfer gear units. Modern automated facilities consume 35 kWh to 55 kWh per ton of raw oil.
3. Heating Fuel Requirements
Evaporation and molecular distillation require precise temperature controls (up to 320°C–380°C). Burners utilize natural gas (25–35 m³/ton), diesel, or recovered non-condensable process off-gas to minimize external fuel purchases.
4. Chemical Consumables & Catalysts
- Activated Clay / Adsorbents: Removes color compounds and residual odors in clay finishing units (typically 2%–5% by weight).
- Hydrotreating Catalysts: Used in advanced catalytic hydrotreating plants to remove sulfur, nitrogen, and unsaturated hydrocarbons, producing premium Group II base oils.
- Flocculants & Neutralizing Agents: Used for pre-treating heavily contaminated sludges.
5. Labor Overhead
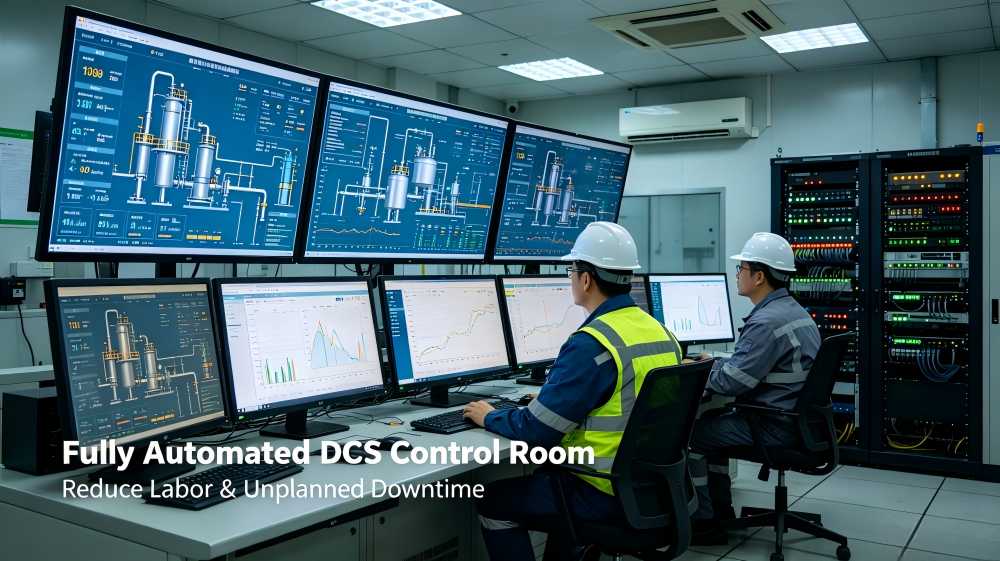
Fully automated PLC/DCS systems allow a 20 TPD plant to run with 3 operator technicians per shift, supported by engineering and management staff.
6. Preventive Maintenance & Waste Handling
Allocating 2% to 4% of machinery value annually covers replacement seals, heat exchanger decoking, vacuum pump servicing, and regulatory disposal of heavy residue sludges.
Section 6: Technical Factors That Improve ROI
Plant operators can maximize profitability by implementing key process improvements:
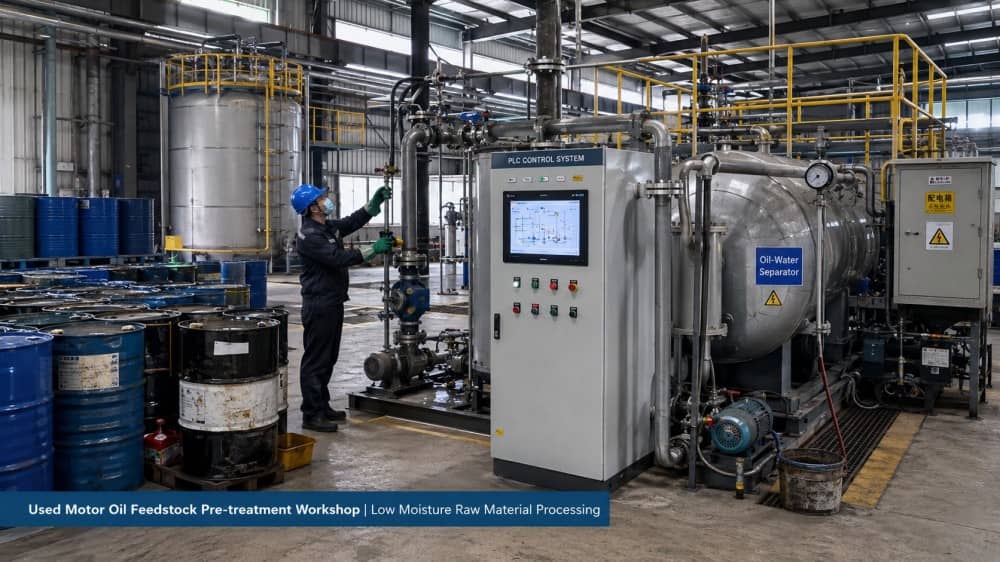
- Sourcing High-Quality Feedstock: Securing feedstock with low water content (<5%) and minimal solid sediments reduces pre-treatment energy loads and directly maximizes base oil recovery yield.
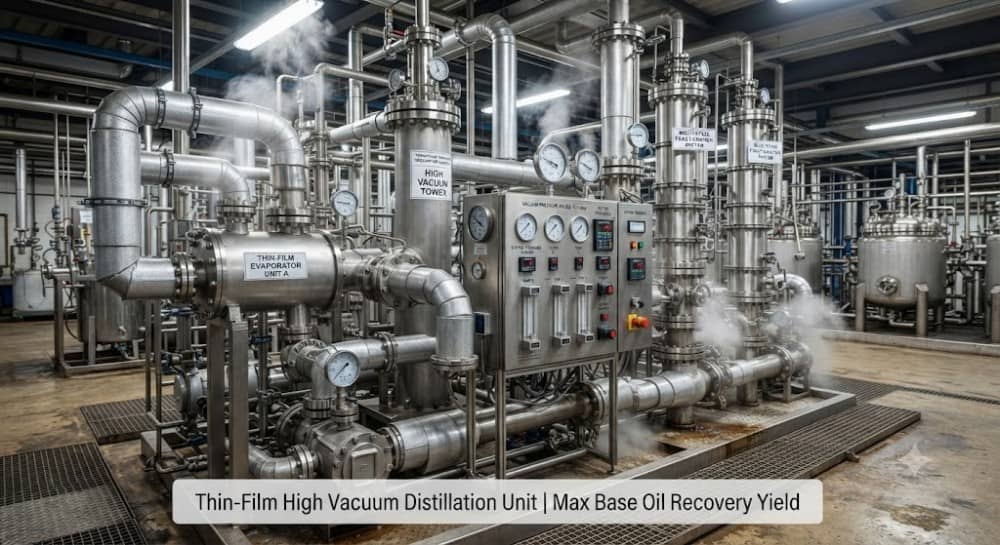
- High-Vacuum Distillation Optimization: Operating at deep vacuum levels (<10 Pa / 0.1 mbar) lowers boiling points, preventing thermal cracking, reducing coking, and saving fuel.
- Efficient Fractionating Systems: Continuous thin-film evaporators (TFE) prevent thermal degradation and ensure precise separation into SN150, SN300, and SN500 base oil grades.
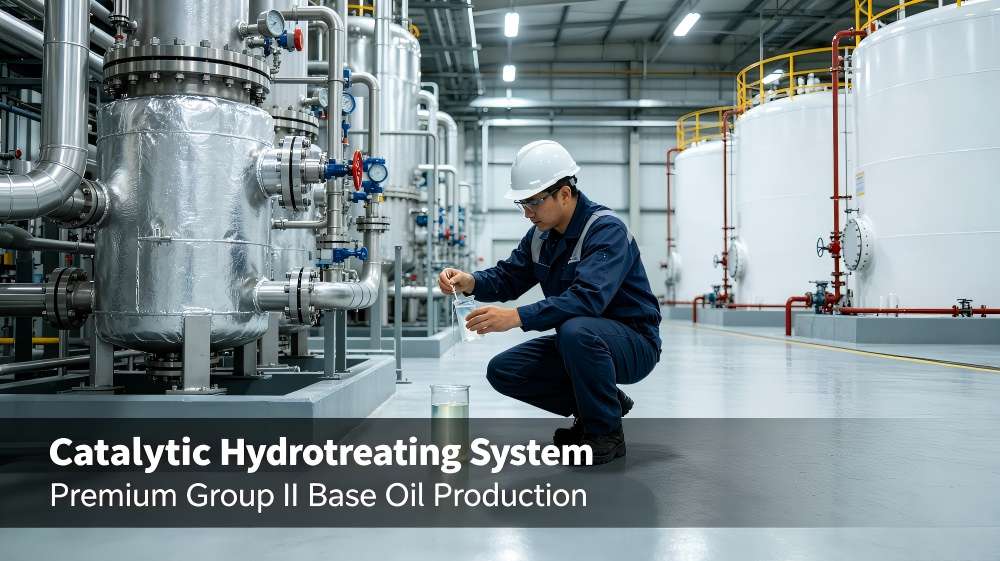
- Upgrading to Catalytic Hydrotreating: Transitioning from traditional clay polishing to catalytic hydrotreating produces water-white Group II base oils, commanding price premiums of $150 to $300 per ton.
- In-Line Solvent Recovery: Advanced extraction systems achieving >99.5% solvent recovery significantly cut operational solvent makeup costs.
Section 7: Benchmark Comparison: Legacy vs. Efficient Plant Design
| Evaluation Parameter | Legacy / Low-Cost Plant Design | Advanced Continuous Hydrotreating Plant |
| Base Oil Yield (%) | 60% – 65% (Higher thermal cracking loss) | 76% – 82% (Optimized thin-film evaporation) |
| Base Oil Output Quality | Group I (Darker color, potential odor) | Group II (Water-white, high Viscosity Index) |
| Specific Energy Use | High (>60 kWh/ton, unrecovered heat) | Low (<38 kWh/ton, full heat integration) |
| Solvent / Chemical Loss | Elevated chemical consumption & sludge | Closed-loop solvent recovery (>99.5%) |
| Unscheduled Downtime | Frequent decoking cleanouts (30–45 days/yr) | Minimal interruptions (<15 days/year) |
| Net Profit per Ton | $65 – $90 / Ton | $150 – $220 / Ton |
| Project Payback Period | 4.5 to 6.0 Years | 1.8 to 2.5 Years |
Section 8: How to Shorten the Payback Period
To compress the investment payback timeline to under 24 months, plant operators can apply eight strategic operational adjustments:
1. Maximize Base Oil Yield: Optimize wiped-film evaporator temperatures to extract maximum lube fractions from feedstock.
2. Secure Cheaper Feedstock: Negotiate direct supply contracts with large fleets and industrial plants to bypass middleman margins.
3. Minimize Plant Downtime: Maintain preventive decoking schedules and monitor vacuum pumps to maintain annual operating time above 330 days.
4. Optimize Solvent Recovery: Maintain closed-loop extraction temperature controls to keep solvent losses below 0.5%.
5. Produce Higher-Value Products: Target high-grade industrial lubricant markets by producing premium Group II base oils.
6. Optimize Hydrogen Consumption: Deploy off-gas purge hydrogen recovery systems in hydrotreating units.
7. Implement Waste Heat Integration: Pre-heat incoming cold feedstock using hot distillation bottoms via multi-pass heat exchangers to reduce utility fuel consumption by up to 30%.
8. Scale Plant Capacity: Increasing throughput capacity from 10 TPD to 30 TPD lowers fixed operating overhead per ton.
Section 9: Common ROI Calculation Mistakes to Avoid
When evaluating a project’s feasibility, don’t make these eight common financial modelling mistakes:
- Ignoring Operational Downtime: Modelling 365 days of operation without budgeting for mandatory decoking, catalyst regeneration and maintenance outages.
- Maintenance reserves not included: Pump seal overhauls not included, nor valve replacements or thermal fluid additions.
- Ignoring Sludge Disposal Costs: Failure to account for the cost of transporting and disposing of hazardous distillation bottoms or spent clay.
- Ignoring chemical losses: Assuming 100% solvent recovery or ignoring catalyst replacement schedules
- Ignoring Wastewater Treatment Overhead: Ignoring that water separated from raw UMO must be treated with oil-water separation before discharge.
- Ignoring Depreciation of Equipment: Not including linear mechanical depreciation charges affecting tax calculations.
- Not managing working capital: Not funding 60-90 days of feedstock inventory and receivables.
- Regulatory Costs: Omitting stack emission testing, environmental monitoring, and safety permit renewal fees.
Section 10: Why Plant Design Matters More Than Machinery Purchase Price
A common mistake is to select waste oil recycling equipment based purely on the cheapest initial purchase price. Machinery CAPEX is a small portion of the total life-cycle costs.
- Total Cost of Ownership (TCO) Insight: A low-cost plant with inefficient vacuum packages, basic insulation and rudimentary distillation columns often has the problems of lower yield (60%–65%), higher fuel consumption and frequent coking downtime. The savings on equipment purchase are generally offset by increased energy bills and yield losses within 24 months. Continuous thin film evaporation and a rugged plant design translate into lower operating costs and increased profitability in the long run.
Section 11: Frequently Asked Questions (FAQ)
1. What is a good ROI for a waste oil recycling project?
A well-designed waste oil recycling plant operating under standard market conditions typically achieves an annual net ROI of 30% to 50%. Facilities with hydrotreating technology producing Group II base oils can exceed 50% ROI when feedstock pricing is well-managed.
2. How long does it take to recover the total investment?
Average payback periods range between 2.0 and 3.5 years for continuous processing facilities (15 TPD to 50 TPD capacity). Batch-type plants or units with high downtime may take 5 years or longer to recover initial capital.
3. Which factor affects waste oil recycling ROI the most?
Feedstock procurement cost has the largest impact, as raw material accounts for 60% to 75% of total operating expenses. The price spread between raw UMO and finished base oil dictates gross profit margins.
4. Does higher base oil yield always guarantee higher profit?
Generally yes, provided quality standards are maintained. Forcing higher yields by raising distillation temperatures too high without sufficient vacuum causes thermal cracking, resulting in darker, unstable base oil that sells at a market discount. Optimization requires balancing yield volume with product purity.
5. What plant capacity offers the fastest payback period?
Continuous plants operating between 20 TPD and 50 TPD deliver an optimal balance between initial CAPEX investment and operational economy of scale, leading to shorter payback periods under 2.5 years.
6. How do feedstock price fluctuations impact long-term profitability?
Because finished base oil market prices track global crude and refined product benchmarks, base oil selling prices generally move in tandem with raw UMO collection costs, preserving operating margins across market cycles.
7. Is hydrotreating necessary to achieve a high return on investment?
While traditional solvent extraction and clay finishing yield good returns on Group I oils, catalytic hydrotreating delivers higher long-term margins by generating water-white Group II base oils that command premium pricing in global markets.
8. What is the average operating cost (OPEX) per ton of processed waste oil?
Excluding raw feedstock procurement, operational expenses (utilities, labor, catalysts, maintenance, overhead) typically range between $120 and $180 per ton of processed oil, depending on plant scale and automation levels.